Tables, charts and diagnostics
The Reports menu holds the tables, charts and diagnostics of the open file. Its commands depend on the program the file came from.
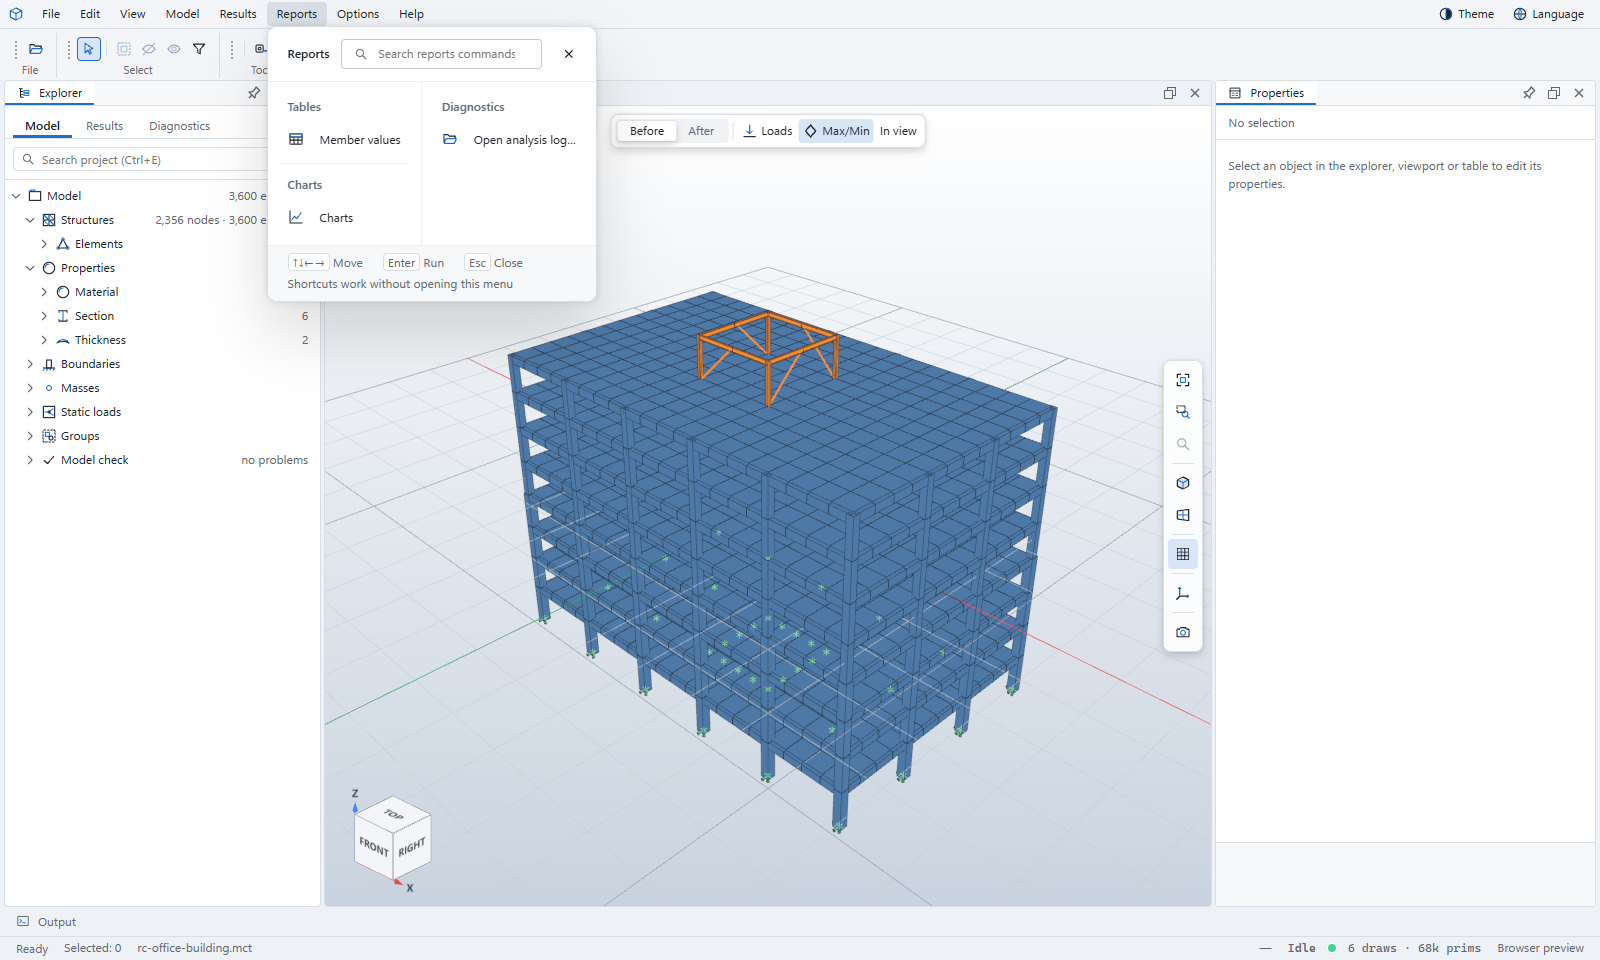
Tables
| File | Tables |
|---|---|
| MIDAS, ETABS | Member values: the values of the result tables you opened |
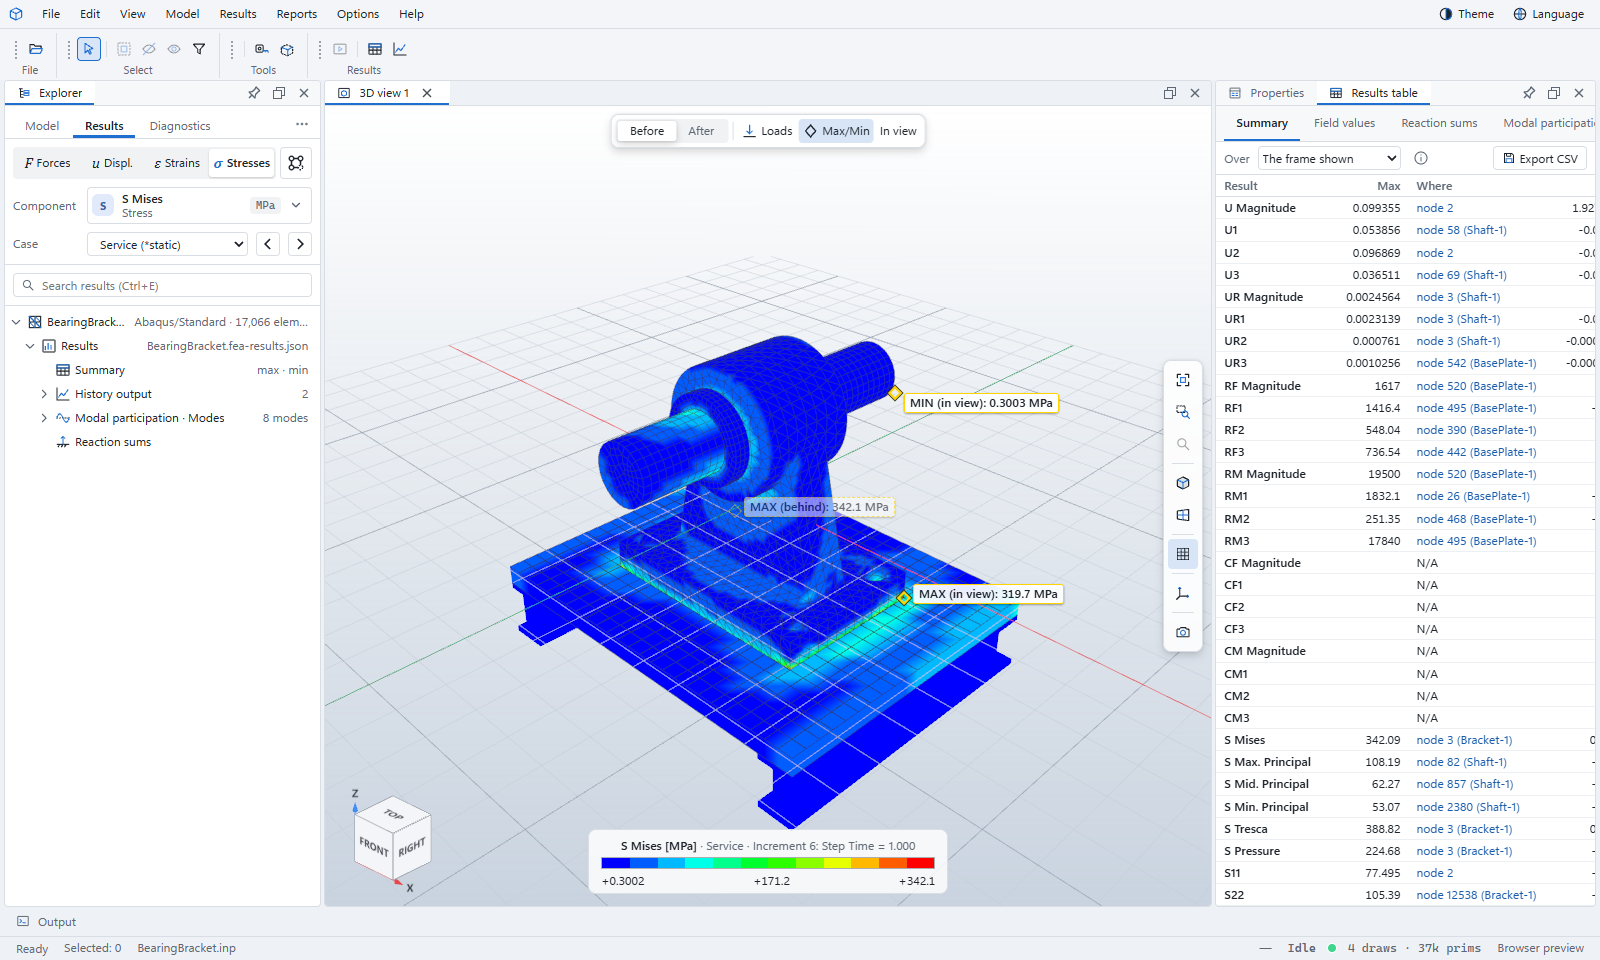
| Abaqus | Summary table: the extreme of every result and where it occurs; Reaction sums; Modal participation |
Tables open beside the 3D view. Clicking a node or element in a table finds it in the model. Export CSV saves the table for Excel.
Charts
- Periods chart (Results tab of a model with modes): the period of each mode.
- Reports › Charts: history output (Abaqus), time histories and other curves from tables (MIDAS).
- Run channels (OpenFAST): the channels of a run, one chart per unit; click a chart to go to that time; save as CSV or SVG.
Charts open as tabs in the main area, so you can put one beside the 3D view.
Diagnostics
The Explorer's Diagnostics tab lists the errors and warnings met while reading the file, and how the job ended — for example Completed. For Abaqus jobs, Reports › Job messages explains each message from the .msg, .sta and .dat files in plain language. For MIDAS models, Reports › Open analysis log… reads the .out log.
Model checks
Model › Model check lists problems in the model itself, such as unconnected nodes or missing properties. It reports what it finds; it does not change the model.